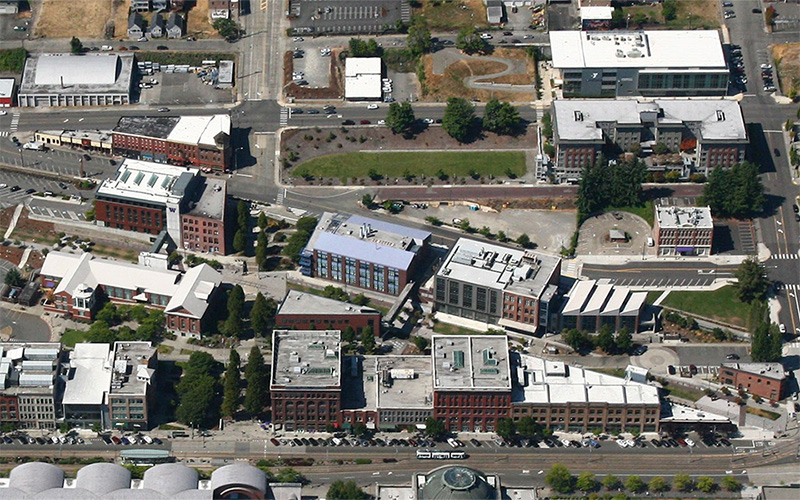
Campus Marks Progress on Resource Conservation
During Earth Week 2020, UW Tacoma is recognizing the hard work of the Facilities Services team in resource conservation, including a 40% reduction in energy use intensity between 2014 and 2018.
This week, the world is celebrating the 50th anniversary of Earth Day (April 22), a moment amid pandemic to step back and examine our progress toward environmental sustainability.
Overall, the record is spotty and progress is uneven, but at the local level of the UW Tacoma campus, we have much accomplishment to recognize.
Only recently have we had the ability to look separately at UW Tacoma’s resource usage data in order to see the trends. For many years, our data was aggregated with data from UW’s other two campuses.
As a tri-campus institution, the UW has been at the forefront nationally in resource conservation and sustainable operations. Comparatively, the Tacoma campus’s identifiable contribution to consumption and conservation has been relatively small (not surprisingly if you compare the relative scale of operations).
As we enter our next third-of-a-century of existence, we are growing in enrollments, employment, square footage and, yes, resource consumption. The opportunity to track and moderate our footprint is expanding.
Diligence and Technology
Allan Cortina is UW Tacoma’s newish sustainability coordinator. He graduated in 2019 with a B.S. in environmental science and is now studying (remotely this quarter) for a master’s degree in environmental engineering on the UW campus in Seattle.
Cortina came into the sustainability position with a couple of mandates: one, to decarbonize; that is, to position campus operations to be as carbon-neutral as possible. His second mandate is to create a baseline; that is, to document our resource consumption patterns now against which future trends can be measured.
Cortina has unveiled a series of graphs, below, which show the last several years of resource use at UW Tacoma for electricity, natural gas, water and solid waste.
The data is collected by the campus’s Facilities Services department, using a system called the Energy Star Portfolio Manager. Energy Star is backed by two U.S. federal agencies, the Environmental Protection Agency and the Department of Energy. The portfolio manager is said to be the most-used energy measurement and tracking tool for commercial and institutional buildings.
As you will see in the visualizations below, by and large UW Tacoma is seeing positive trends in resource management. Cortina is quick to shine a spotlight on the role of Facilities Services in this accomplishment.
“We really need to amplify the important role Stanley Joshua, director of Facilities Services, and his team have played in ‘flattening the curve’ of resource use at UW Tacoma,” said Cortina.
“Facilities has been focusing on efficiency for a number of years,” he said. “They’ve incorporated that emphasis into all their planning. They are really diligent about leveraging technology.”
Reduce the Juice
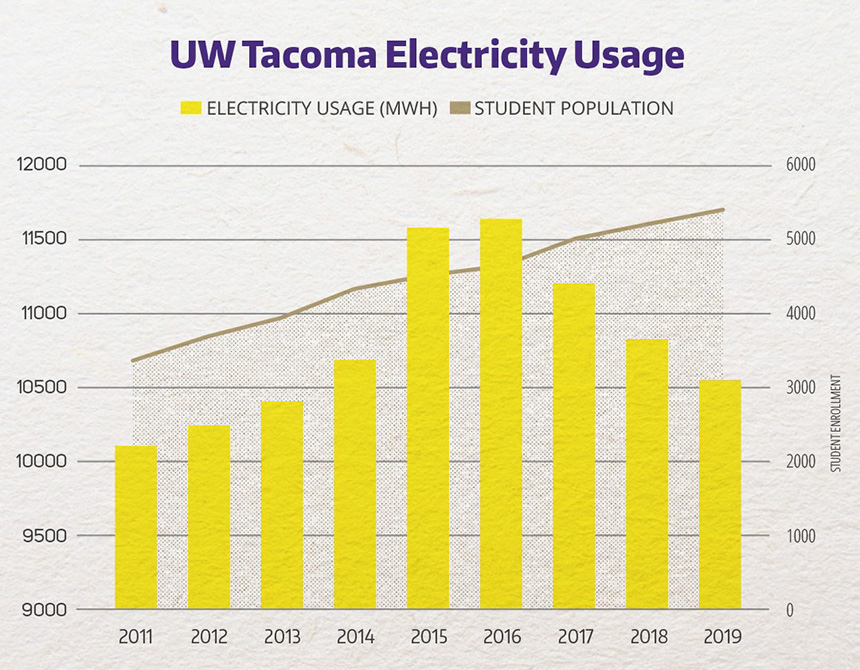
As shown in a graph of megawatt hours (MWh) per year of electricity consumption, UW Tacoma’s electricity use peaked in 2016 at about 11,600 (MWh) and has dropped steadily since then to just about 10,500 MWh, a level last seen in 2014. This reduction has happened despite steady growth in student enrollment and faculty and staff hiring.
According to Cortina and Joshua, the reduction is due primarily to the ongoing work to replace older incandescent and fluorescent light fixtures with LED fixtures, which are much more efficient. Simultaneously, simple on/off switches have been replaced with motion-detector/timer switches.
And UW Tacoma’s ongoing program of classroom “refreshes” includes upgrades of computer hardware, video screens and other electrical appliances with more-efficient versions.
Bypass the Gas
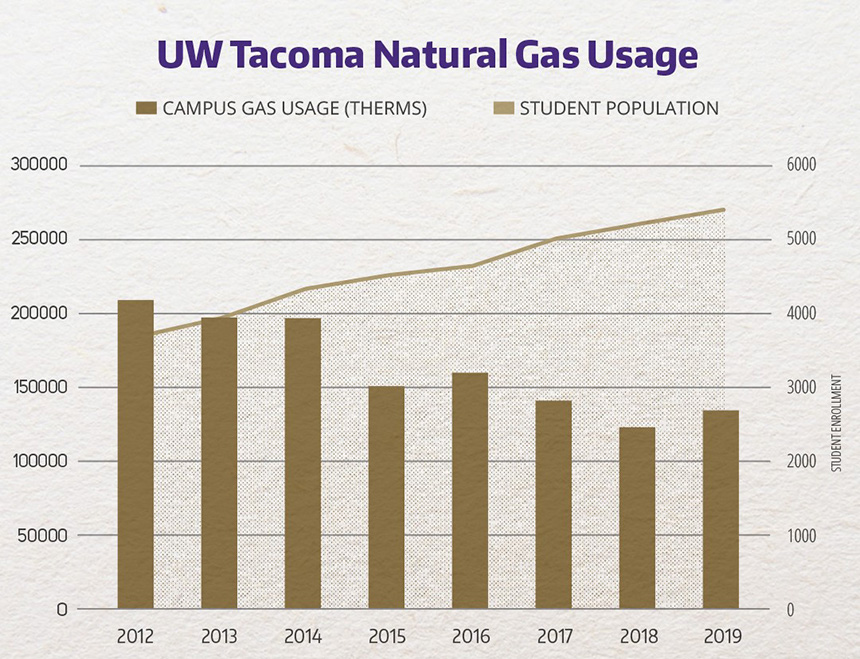
Natural gas use at UW Tacoma has also been on a steady decline since 2012, a slight uptick in 2019 notwithstanding. Use in 2012 was at slightly more than 200,000 therms (a therm is the amount of gas needed to generate 100,000 BTUs, about 100 cubic feet).
Most natural gas at UW Tacoma goes to fire our nine boilers, which provide our heat. As our boilers reach the end of their service life, Facilities Services plans to replace them with large electric condensing boilers. Converting to electricity cuts our consumption of fossil fuels: electricity from Tacoma Public Utilities is 98% carbon free.
Lower the Power
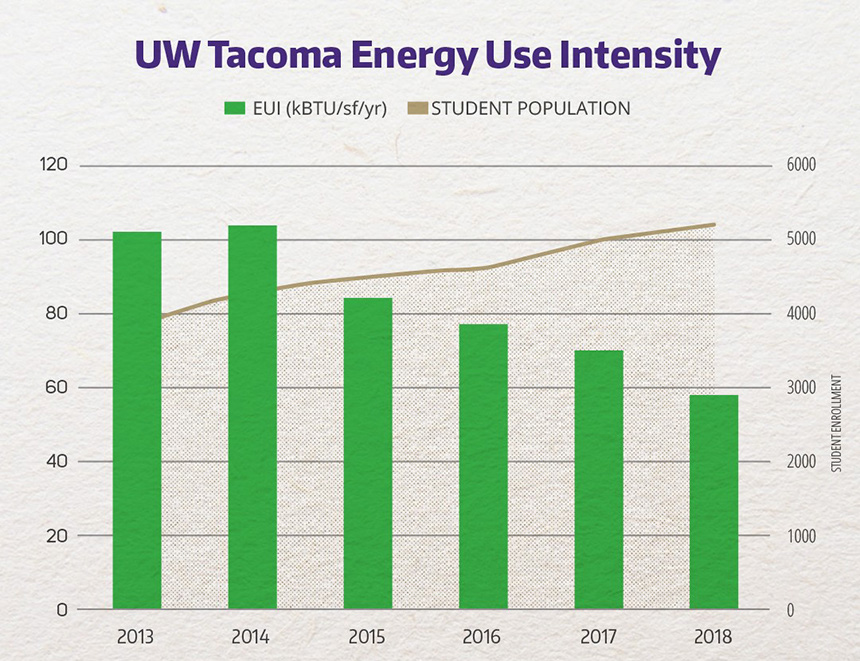
Energy Star came up with the “energy use intensity” measure as a way of developing an apples-to-apples comparison of energy consumption (electricity and gas) in buildings and institutions.
At UW Tacoma, our energy use intensity (consumption in kilo-BTUs per square foot per year) peaked at just over 100 kBTU/ft2 in 2014 and has steadily declined to below 60 kBTU/ft2 in 2018. This is even as student, faculty and staff headcounts increased.
This is well below the median usage of 84.3 kBTU/ft2 that Energy Star reports for colleges and universities in the U.S.
Paste the Waste
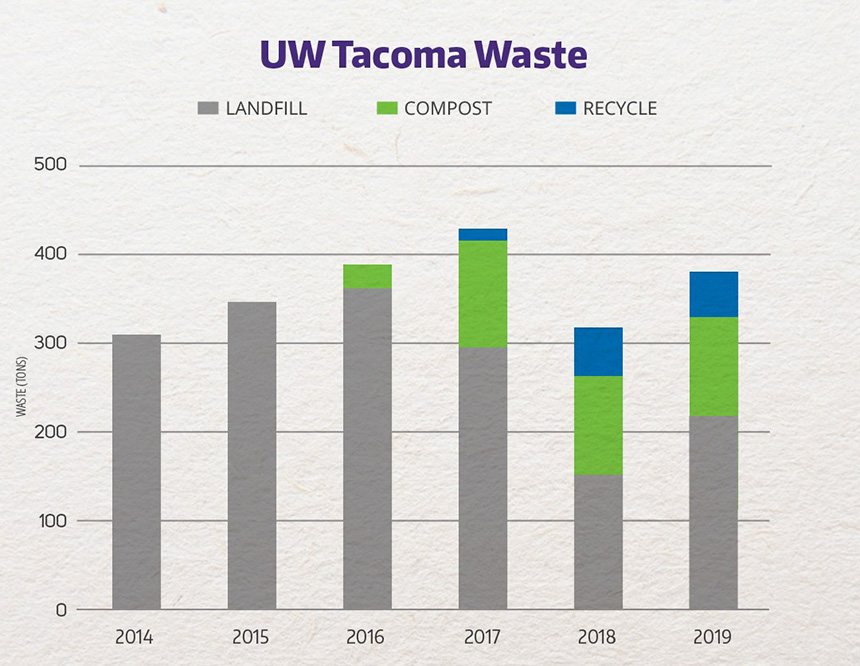
Solid waste at UW Tacoma is a complicated topic.
The graph shows a relatively large drop in waste destined for landfill, recycling or compost from 2017 to 2018, about a 100-ton decline; followed by an increase from 2018 to 2019, erasing much of the 2018 reduction.
To look at the graph you might think we only started recycling in 2017. That is misleading: we started *tracking* our long-standing program of recycling in 2017. And, unfortunately, lately the recycling market has been very volatile. For reasons outside UW Tacoma’s control, our recycling program has not been able to expand as we would wish.
Composting is a success story. We compost through Cedar Grove: the bulk of our compostables are paper towels from restrooms (obviously not an issue during pandemic-required remote instruction). We are able to divert significant material from landfills through this program.
Don’t Sweat the Wet
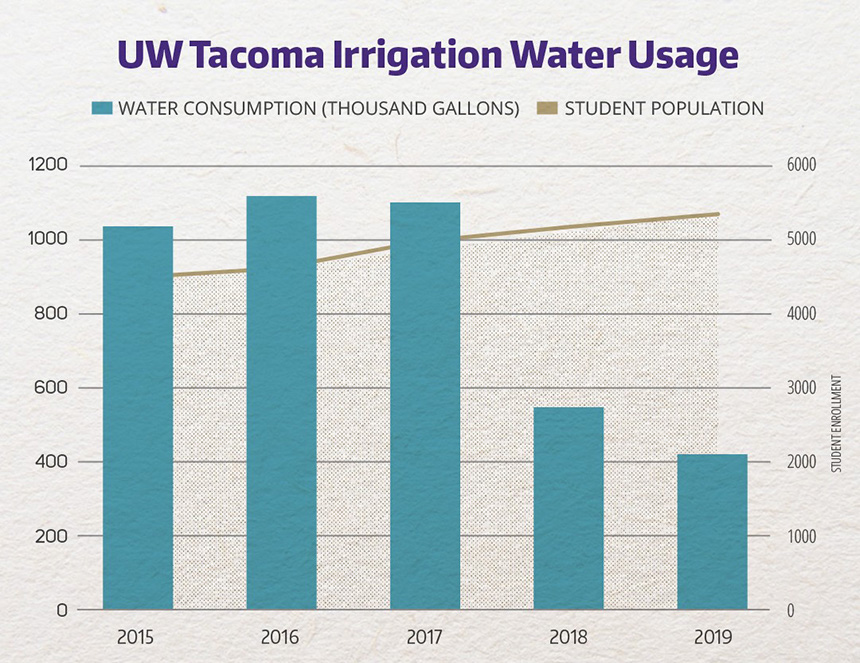
Overall water consumption at UW Tacoma is in the form of so-called “domestic” consumption (toilets and sinks) and irrigation.
Domestic consumption is by far the largest component. Between 2018 and 2019 we saw a modest reduction in total (domestic + irrigation) use from about 5.5 million gallons down to 5 million gallons.
This reduction was driven in part by a significant reduction in irrigation use. From a peak of more than 1.1 million gallons in 2016, we have dropped to just over 400,000 gallons in 2019.
This is due to a lot of hard work by Facilities Services in the form of improved irrigating practices, major systems upgrades and a new philosophy of landscaping with drought resistant and native plant species.
Continuous Improvement
Sustainability coordinator Allan Cortina sums up the lessons to be learned from the baseline data he’s collected.
“We’re becoming more efficient even while we are serving more students with more faculty and staff. There is still a lot more that we can do. There are buildings on our campus that haven’t yet been renovated, and systems that are due for upgrades.”
“I expect we will continue to see our energy usage intensity number continue to decline for the foreseeable future,” said Cortina.
But Cortina is not resting on his laurels. Now that he has established the resource baseline, he is turning to the next big challenge: calculating and reducing the campus carbon footprint.


